The Overview Dashboard: Your Portfolio at a Glance
Read the Portfolio Overview metrics and the open options, equity, and recently closed tables.
The command center
Overview is the first screen you land on. It answers "how is my wheel doing?" at a glance with three headline metrics and a set of live position tables.
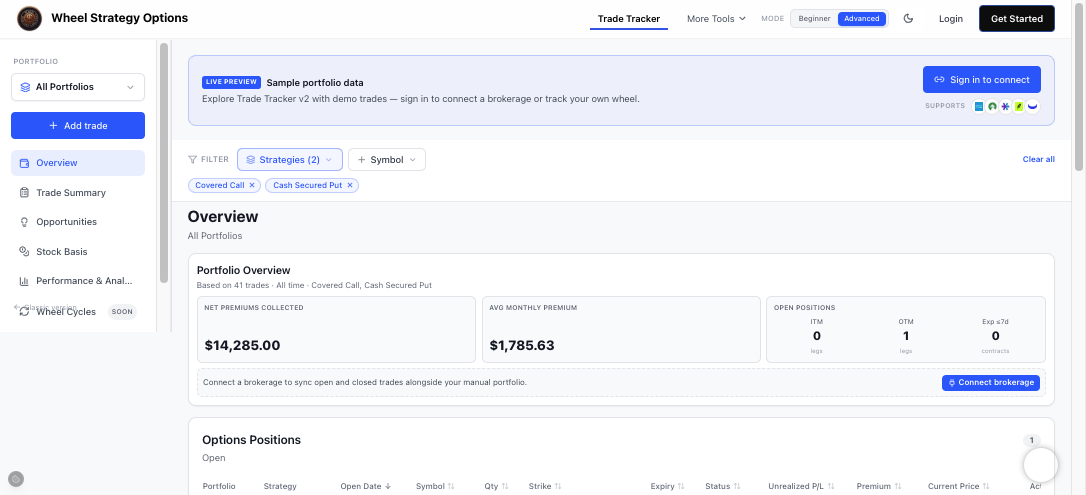
The three headline metrics
- Net Premiums Collected — total credits received minus closing costs, across the selected date range and strategies.
- Avg Monthly Premium — your typical income per month, useful for setting expectations.
- Open Positions — a quick ITM / OTM / expiring-soon breakdown so you know how exposed you are right now.
The subtitle tells you exactly what's included, e.g. "Based on 41 trades · All time · Covered Call, Cash Secured Put." Change the filters and these numbers update.
When you include open credits in the overview, Net Premiums splits into realized P/L from closed legs and unrealized P/L from still-open credits — so you can see booked income separately from premium still at risk.
The position tables
Scroll down and you'll find three tables:
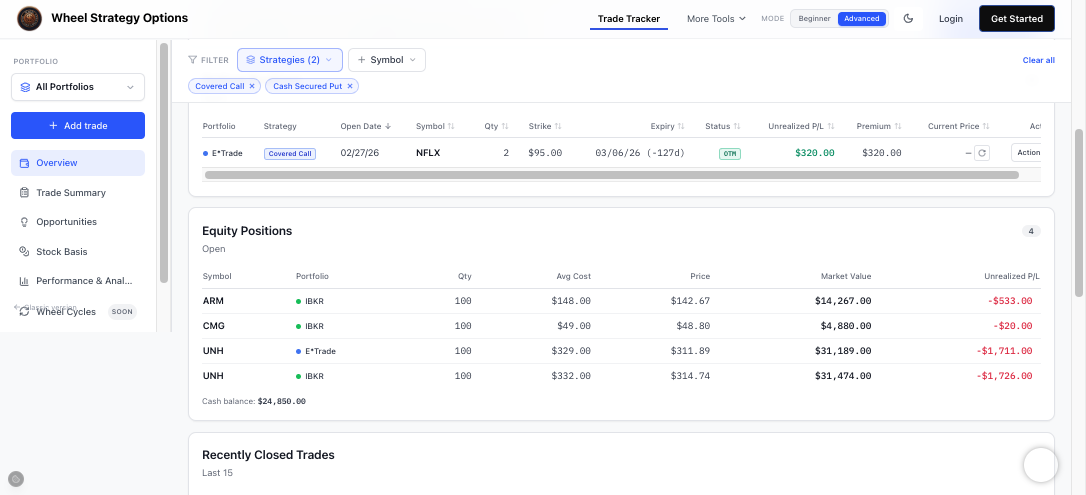
- Options Positions (Open) — every live covered call and cash-secured put, with strike, expiry, days to expiration, status (ITM/OTM), unrealized P/L, premium, and current price.
- Equity Positions (Open) — shares you hold, with quantity, average cost, current price, market value, and unrealized P/L, plus your cash balance.
- Recently Closed Trades — your last 15 settled trades so you can see recent outcomes without leaving the page.
Click any symbol to drill into a per-symbol view, or use the Actions menu on a row to edit, close, or roll a position.
How to read it each week
- Glance at Open Positions — anything ITM or expiring within 7 days?
- Scan Options Positions for unrealized P/L outliers.
- Confirm cash balance and uncovered shares so you know what you can put to work next (the Opportunities tab makes this actionable).
Frequently Asked Questions
Why is a position marked ITM or OTM?
The tracker compares each option's strike to the current underlying price. In-the-money (ITM) legs are more likely to be assigned or called away, so they're flagged in the Open Positions summary.