The Income Calendar: Premium by Month
Visualize your net premium income month by month and drill into any period's trades.
See your income rhythm
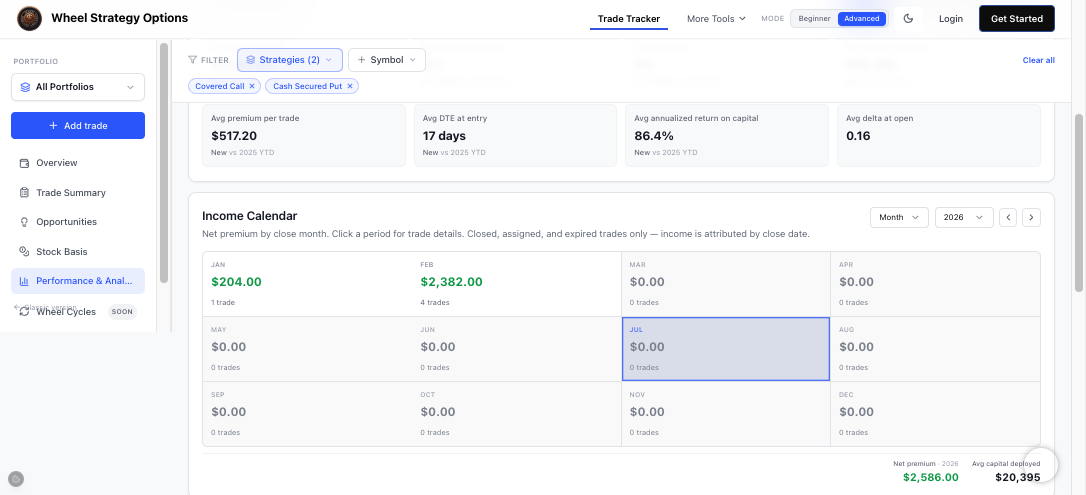
Scroll down within Performance & Analytics and you'll find the Income Calendar — a month-by-month grid of your net premium. It's the fastest way to see your income rhythm and spot seasonality.
How to read it
- Each cell shows a period's net premium and trade count (switch Year / Month / Week / Day above the grid).
- Income is attributed by close date, and only closed, assigned, and expired trades count — so it reflects realized income, not open positions (unless you turn on Include open credits).
- The totals row shows net premium and avg capital deployed for the year.
Use the period controls and arrows to move between months or years.
Rolls book net roll credit
When a short is rolled (buy-to-close the old contract and sell-to-open a new one), the calendar does not dump the full BTC-vs-original-open loss on roll day. Instead:
- Roll day — books the net roll credit or debit (new premium minus what you paid to close the old leg).
- Final exit — books the lifetime remainder versus the chain's opening credit, so total P/L across the roll chain still matches reality.
Exact same-timestamp broker combo rolls are linked first; same-day inferred rolls only when the contract strike or expiration changes (long hedges are not treated as roll destinations).
Drill into a period
Click any cell to open the list of trades that made up that period's income. The header total uses roll-aware nets; individual row P/L in the table still reflects each leg's open→close math.
Why close date?
Attributing income to when a trade closes keeps your monthly numbers honest: a put you sold in January but that expired in February counts toward February, when you actually realized the premium. For rolls, the close that starts the roll books the net roll that day, not a fake mark-to-close blow-up.
Frequently Asked Questions
Why is my income attributed to the close date, not the open date?
Because that's when the premium is actually realized. A trade opened in one month but closed, expired, or assigned in the next counts toward the month it closed, which keeps monthly totals accurate.
Do open trades show up in the Income Calendar?
By default, no — only closed, assigned, and expired trades count as realized income. Turn on Include open credits to also count open short premiums by open date.
How does the Income Calendar treat rolls?
On roll day it books net roll credit (new sell-to-open premium minus buy-to-close cost), not the full loss versus the original open. When you finally close the rolled-into leg, the remaining lifetime P/L is booked so the whole chain still adds up.