Covered Call Spreadsheet & Wheel Strategy Tracker in Google Sheets
Google Sheets column layout for wheel CSPs and covered calls, with links to the multi-tab tracker template and in-app wheel strategy tracker.

Introduction
A covered call spreadsheet (and full wheel log) keeps premium, strikes, DTE, and assignment outcomes in one place. The wheel runs on rhythm: sell a cash-secured put, optionally take assignment, then sell covered calls against shares—none of that works well if your log is messy. This guide walks through a practical Google Sheets layout so you can track open CSPs and CCs, assignments, cost basis, and notes in one place. For a full template with tabs already wired up, copy the <a href="https://wheelstrategyoptions.com/blog/precision-options-selling-advanced-tracker-guide-with-a-free-google-sheets-template/">free Wheel Strategy Options Tracker</a> (multi-tab Google Sheets template)
Setting Up Your Wheel Tracking Spreadsheet
Create a new Google Sheet and name it something descriptive like "Wheel Options Tracker." Here's a suggested structure for your columns:
- Ticker: The underlying asset symbol (e.g., AAPL, MSFT – but for this example, we'll use fictional tickers like FICT1, FICT2).
- Trade Type: (Put, Covered Call)
- Action: (Selling, Buying, Assigned, Expired)
- Strike Price: The strike price of the option.
- Premium Received/Paid: The premium collected or paid for the option.
- Expiration Date: The option's expiration date.
- Quantity: Number of contracts or shares.
- Cost Basis (if assigned): The price you paid for the shares if your put was assigned.
- Current Price: Use
=GOOGLEFINANCE(A2, "price")(assuming "Ticker" is in column A). This dynamically updates the current market price. - Profit/Loss: Calculate your P/L based on current price and premiums. For puts, it could be
=F2-(B2*100)if assigned or=F2if expired. For calls, it might be=F2+(E2*100)-H2. - Notes/Watchlist: Add any relevant observations or track potential future trades here.
- Trade Status: Open, Closed

Managing Active and Watchlist Trades
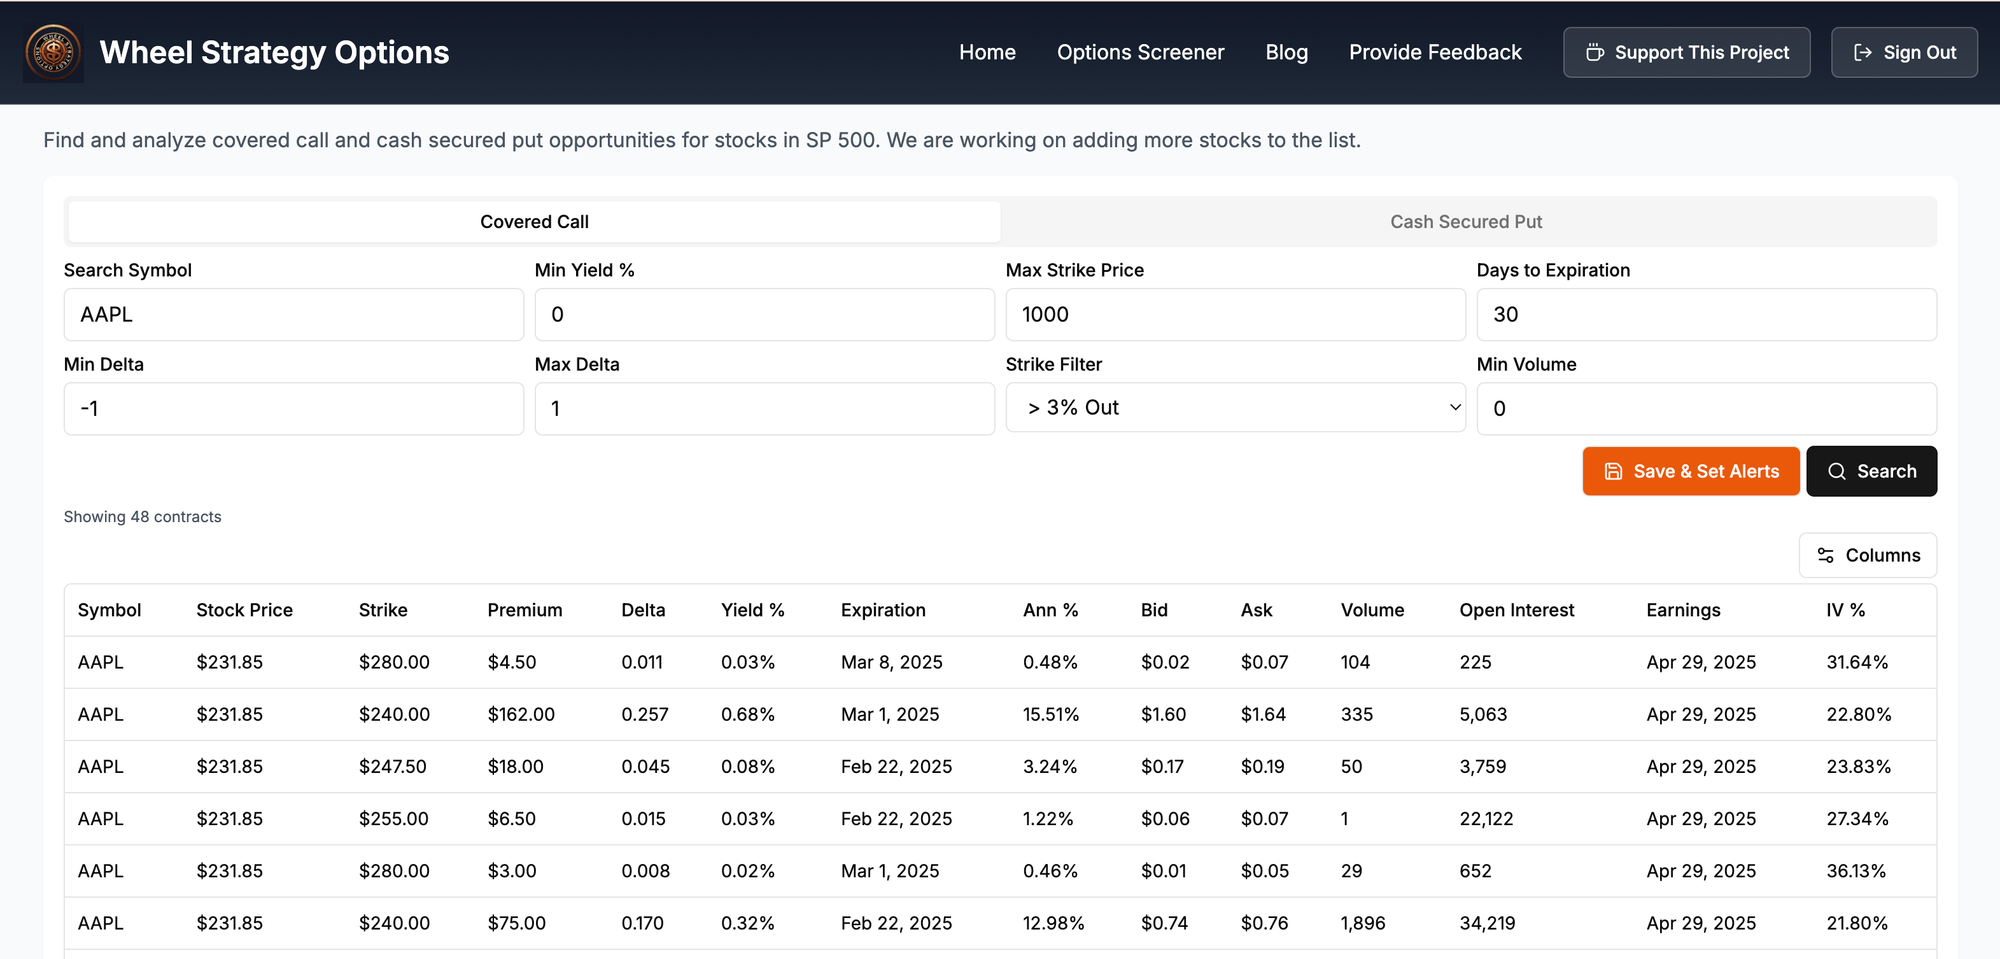
Find trades to log: Run the Cash-Secured Put Screener or Covered Call Screener, then paste strikes and premium into your sheet—or use the Trade Tracker if you want alerts without maintaining every formula.
Active Trades:
Input all details of your active trades. Regularly update the "Action" and "Trade Status" columns. As trades expire or get assigned, ensure your cost basis (if assigned on a put) and profit/loss are accurately updated. For example, if FICT1 is assigned at $100, input $100 in "Cost Basis." Then your "Profit/Loss" on the covered call would reflect the difference between the call's strike, premium, and this cost basis.
Watchlist:
Use the "Notes/Watchlist" column to list tickers and strike prices you're considering. Input potential trade parameters and then use the live "Current Price" to monitor price action and identify opportune entry points. Example: "FICT2 - Watching for put sell at $50 strike if price drops below $48."
Analyzing Your Performance
What columns should a wheel strategy spreadsheet include?
At minimum: ticker, trade type (CSP or covered call), strike, premium received, expiration/DTE, quantity, assignment status, cost basis after assignment, and running P/L. Add a notes column for rolls, earnings, and why you opened the trade.
Should I build a sheet from scratch or use a template?
Start from the free multi-tab Google Sheets tracker if you want tabs for CSPs, covered calls, assignments, and cost basis already wired. Use this column guide when you want a lighter custom layout.
How do I track assignment and cost basis in Google Sheets?
When a CSP is assigned, record the effective share cost (strike minus premium per share). Your next covered call P/L should reference that cost basis so you are not guessing whether a call-away was actually profitable.
Use Google Sheet functionalities like SUM, AVERAGE, and COUNTIFS to analyze your trading performance. For example, you could calculate:
- Total premiums collected
- Average profit/loss per trade
- Win rate (percentage of profitable trades)
Example Scenarios and Risk/Benefit Analysis
Scenario 1: You sell a put on FICT1 at $100 strike for $2 premium. If FICT1 stays above $100, you keep the $200 premium (per contract). If FICT1 drops below $100 and you're assigned, you buy 100 shares at $100 each. Your risk is potentially unlimited if FICT1 drops significantly, but your maximum profit is capped at the premium.
Scenario 2: You're assigned FICT1 at $100. You now sell a covered call at $105 strike for $1 premium. If FICT1 stays below $105, you keep the $100 premium, effectively reducing your cost basis to $99. If FICT1 climbs above $105, your shares are called away. Your maximum profit is capped at $600 ($500 price appreciation + $100 premium) per contract.
We highly recommend using our wheel strategy screener to find wheel strategy trades that you can then track with the spreadsheet setup above.
Follow us on:
- Threads - https://threads.net/@wheelstrategyoptions
- X (twitter) - https://x.com/wheel_options
- Reddit - https://www.reddit.com/user/wheelStrategyOptions
- Instagram - https://www.instagram.com/wheelstrategyoptions
Disclaimer: This article is for informational purposes only and not financial advice. Investments are subject to risk and should be carefully analyzed before making any decisions.

Comments ()