Track & Manage Your Wheel Options Trades in Google Sheets

Introduction
The wheel options strategy involves selling put options, buying the underlying asset if assigned, and then selling covered calls. Staying organized is key to successful wheel trading. Let's dive into how a Google Sheet can be your command center for this strategy.
Setting Up Your Wheel Tracking Spreadsheet
Create a new Google Sheet and name it something descriptive like "Wheel Options Tracker." Here's a suggested structure for your columns:
- Ticker: The underlying asset symbol (e.g., AAPL, MSFT – but for this example, we'll use fictional tickers like FICT1, FICT2).
- Trade Type: (Put, Covered Call)
- Action: (Selling, Buying, Assigned, Expired)
- Strike Price: The strike price of the option.
- Premium Received/Paid: The premium collected or paid for the option.
- Expiration Date: The option's expiration date.
- Quantity: Number of contracts or shares.
- Cost Basis (if assigned): The price you paid for the shares if your put was assigned.
- Current Price: Use
=GOOGLEFINANCE(A2, "price")(assuming "Ticker" is in column A). This dynamically updates the current market price. - Profit/Loss: Calculate your P/L based on current price and premiums. For puts, it could be
=F2-(B2*100)if assigned or=F2if expired. For calls, it might be=F2+(E2*100)-H2. - Notes/Watchlist: Add any relevant observations or track potential future trades here.
- Trade Status: Open, Closed

Managing Active and Watchlist Trades
Active Trades:
Input all details of your active trades. Regularly update the "Action" and "Trade Status" columns. As trades expire or get assigned, ensure your cost basis (if assigned on a put) and profit/loss are accurately updated. For example, if FICT1 is assigned at $100, input $100 in "Cost Basis." Then your "Profit/Loss" on the covered call would reflect the difference between the call's strike, premium, and this cost basis.
Watchlist:
Use the "Notes/Watchlist" column to list tickers and strike prices you're considering. Input potential trade parameters and then use the live "Current Price" to monitor price action and identify opportune entry points. Example: "FICT2 - Watching for put sell at $50 strike if price drops below $48."
Analyzing Your Performance
Use Google Sheet functionalities like SUM, AVERAGE, and COUNTIFS to analyze your trading performance. For example, you could calculate:
- Total premiums collected
- Average profit/loss per trade
- Win rate (percentage of profitable trades)
Example Scenarios and Risk/Benefit Analysis
Scenario 1: You sell a put on FICT1 at $100 strike for $2 premium. If FICT1 stays above $100, you keep the $200 premium (per contract). If FICT1 drops below $100 and you're assigned, you buy 100 shares at $100 each. Your risk is potentially unlimited if FICT1 drops significantly, but your maximum profit is capped at the premium.
Scenario 2: You're assigned FICT1 at $100. You now sell a covered call at $105 strike for $1 premium. If FICT1 stays below $105, you keep the $100 premium, effectively reducing your cost basis to $99. If FICT1 climbs above $105, your shares are called away. Your maximum profit is capped at $600 ($500 price appreciation + $100 premium) per contract.
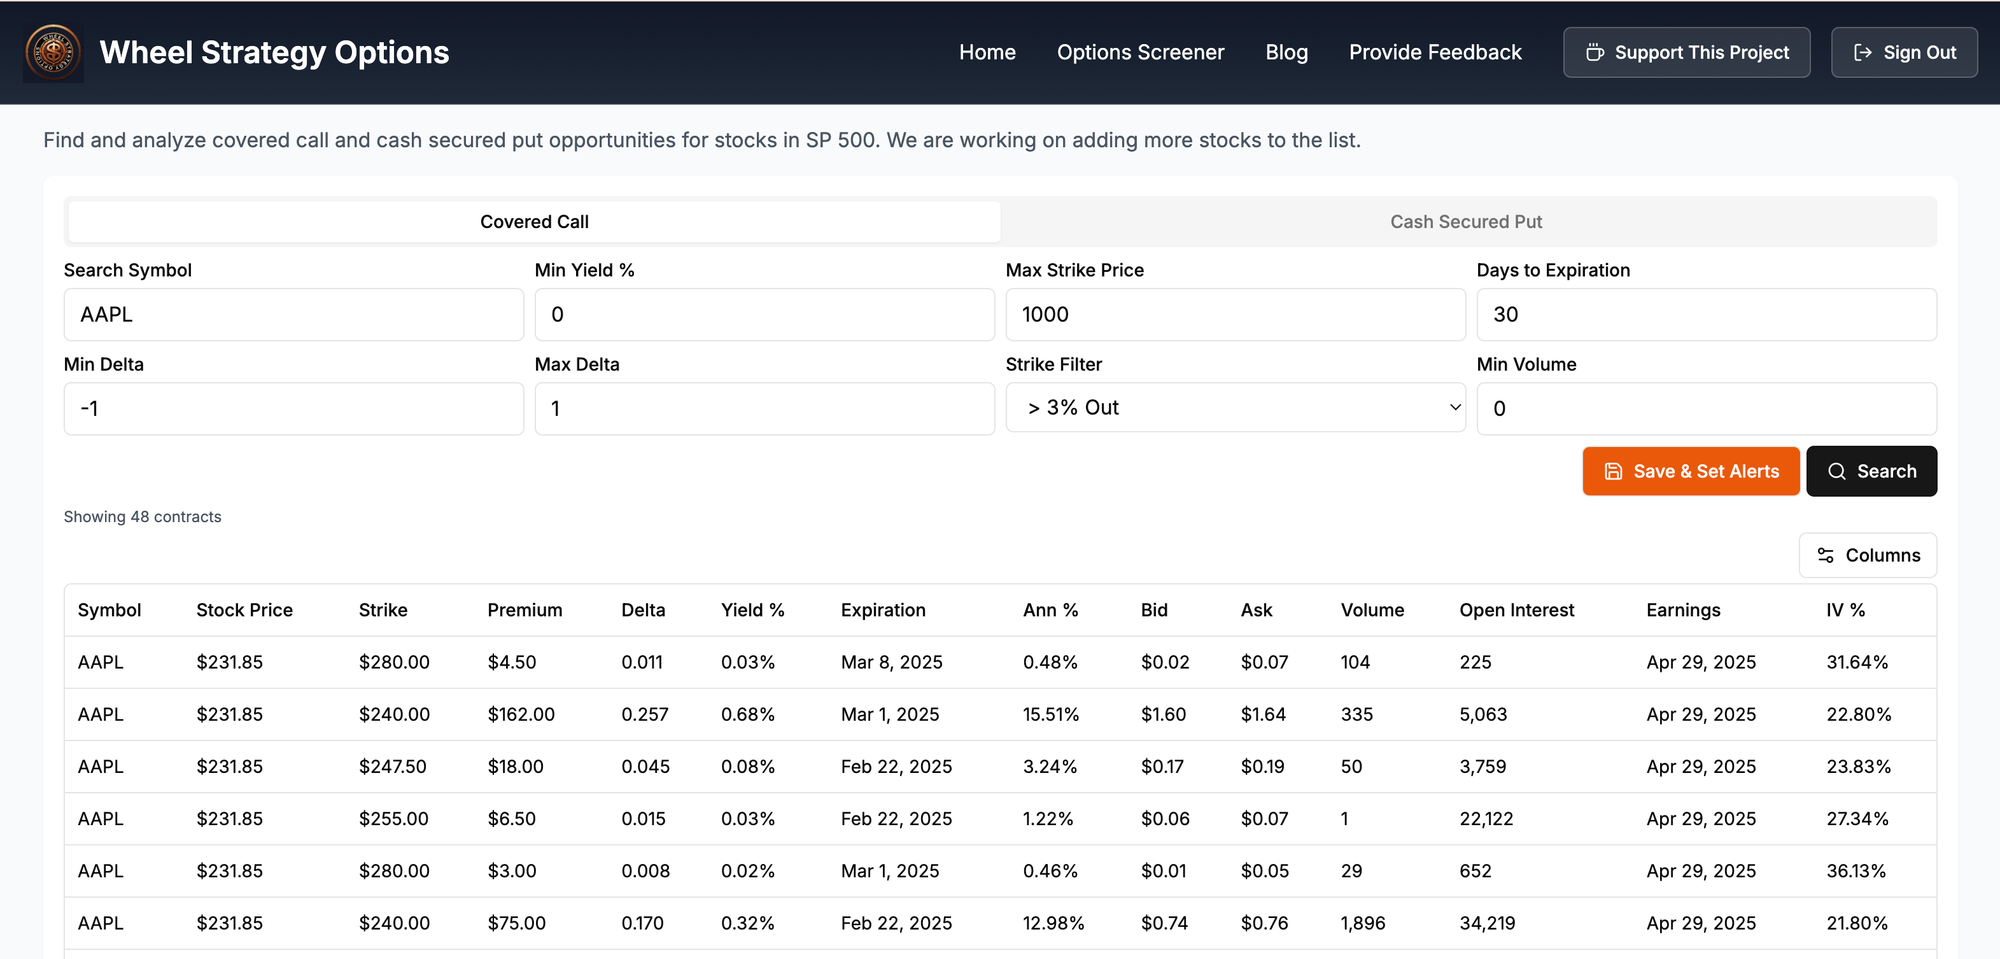
We highly recommend using our wheel strategy screener to find wheel strategy trades that you can then track with the spreadsheet setup above.
Follow us on:
- Threads - https://threads.net/@wheelstrategyoptions
- X (twitter) - https://x.com/wheel_options
- Reddit - https://www.reddit.com/user/wheelStrategyOptions
- Instagram - https://www.instagram.com/wheelstrategyoptions
Disclaimer: This article is for informational purposes only and not financial advice. Investments are subject to risk and should be carefully analyzed before making any decisions.

Comments ()