Optimizing Wheel Strategy: The Imperative of Meticulous Trade Tracking for Superior Returns
In the dynamic landscape of options trading, where volatility and leverage amplify both potential gains and losses, a striking reality persists: studies frequently indicate that a significant majority of retail traders struggle to achieve consistent profitability. While sound strategy is foundational, the delta between theoretical knowledge and sustained success often lies in a critically overlooked component: the rigor of detailed trade tracking.
The Unseen Edge: Why Tracking Transcends Execution in Wheel Options
Many intermediate traders grasp the mechanics of the wheel options strategy—initiating with cash secured puts, managing assignment, and transitioning to covered calls. However, a common pitfall is the reliance on brokerage statements for performance review. These snapshots, while necessary for tax purposes, provide insufficient granular detail to truly optimize the strategy. Without a bespoke system for capturing every nuance of each leg, traders operate in a fog, unable to discern subtle patterns, identify systemic errors, or replicate successful methodologies.
“What gets measured gets managed.”- Peter Drucker
This timeless management principle applies profoundly to options trading. Superficial tracking yields superficial insights, leading to suboptimal adjustments and missed opportunities to enhance premium capture and mitigate risk in selling options.
Beyond Basic Metrics: What to Track for Comprehensive Wheel Analysis
True optimization demands a deeper dive into the data. Consider the following critical elements for each options contract and underlying share position:
Key Data Points for Each Wheel Leg:
- Trade Identifier: Unique ID for each wheel cycle (e.g., XYZ Corp Wheel #123).
- Underlying Asset: Ticker (e.g., XYZ Corp).
- Trade Type: CSP, Assignment, Covered Call, Roll.
For Cash Secured Puts (CSPs):
- Entry Date & Time: Precise timestamp.
- Strike Price: Chosen strike.
- Premium Received (per contract): Gross credit.
- Contracts Traded: Number of contracts.
- Days to Expiration (DTE) at Entry: Crucial for time decay analysis.
- Implied Volatility (IV) at Entry: Assess IV environment.
- Underlying Price at Entry: Stock price when the put was sold.
- Exit Date & Time (if closed): Timestamp of closing.
- Cost to Close (per contract): Debit paid to close.
- Net Profit/Loss (CSP leg): Premium received - cost to close.
- Assignment Status: Assigned (Yes/No).
For Assigned Shares and Covered Calls (CCs):
- Assignment Date: Date shares were assigned.
- Cost Basis (per share): Strike price of assigned put - (net premium per share from CSP).
- Shares Acquired: Number of shares.
- Covered Call Entry Date & Time: Timestamp.
- CC Strike Price: Chosen call strike.
- CC Premium Received (per contract): Gross credit.
- CC Contracts Traded: Number of contracts (matches shares/100).
- CC DTE at Entry & Exit: For time decay analysis.
- CC IV at Entry & Exit: Assess IV changes.
- Underlying Price at CC Entry & Exit: Stock price movement.
- Roll Adjustments: Details of rolling (new strike, new DTE, net credit/debit).
- CC Expiration Status: Expired OTM, Closed, Assigned.
- Net Profit/Loss (CC leg): Premium received - cost to close (if any).
Overall Wheel Cycle Metrics:
- Total Capital Deployed: Cash held for CSP, or capital for shares.
- Total Duration of Cycle: Start of CSP to end of CC cycle.
- Cumulative Net Profit/Loss (Full Wheel Cycle): Sum of all legs.
- Return on Capital (RoC) for Cycle: (Cumulative Net P/L / Total Capital) * 100%.
- Annualized RoC: RoC * (365 / Duration).
Quantitative Edge: Unveiling Performance Patterns and Optimizing Strategy
With this rich dataset, traders can transform raw figures into actionable intelligence. This is where advanced analysis truly shines:
Identifying Winning & Losing Setups:
By analyzing numerous wheel cycles, you can identify patterns:
- Which DTE ranges for selling options (e.g., 30-45 DTE, 7-21 DTE) consistently yield higher annualized returns for similar risk profiles?
- What IV percentile ranges (e.g., selling when IV is in the top 30%) for initial cash secured puts result in the best risk-adjusted premiums?
- Are certain strike price selections (e.g., 10 Delta, 20 Delta) more prone to assignment, and how does assignment impact the overall cycle's profitability?
Analyzing the Impact of Market Conditions:
Cross-reference your trade data with market conditions:
- How did underlying volatility (VIX movements), interest rate changes, or sector-specific news impact the profitability of your covered calls?
- Did wheeling specific stocks (e.g., growth vs. value, high beta vs. low beta) consistently lead to superior outcomes under certain market regimes (e.g., bull, bear, sideways)?
As the eminent investor Ray Dalio often emphasizes about Bridgewater Associates' approach:
“We believe that the best way to make good decisions is to objectively synthesize information from many sources.”- Ray Dalio
Your trade log is your primary source of objective information. Synthesizing it meticulously empowers better decision-making.
From Data to Decisions: Actionable Insights for Strategy Refinement
The ultimate goal of detailed tracking is not merely record-keeping but enabling continuous strategy refinement. Here's how to translate insights into action:
Adaptive Strategy Modification:
- Refining Strike Selection: If data shows deeper OTM CSPs rarely get assigned but yield insufficient premium, you might adjust to selling slightly closer to the money, perhaps targeting a 25-30 delta instead of 10-15.
- Optimizing Exit Strategy: If closing CSPs at 50% profit consistently outperforms holding to expiration, codify this rule. Similarly, for covered calls, analyze whether rolling up and out, or letting shares get called away, yields better long-term returns given your capital efficiency goals.
- Managing Assignment: Understand the actual cost basis of assigned shares. Is it truly optimal to hold through a significant dip waiting for a rally to sell a covered call at a profitable strike, or would it be more capital-efficient to cut losses and redeploy capital?
Risk Management Refinement:
Tracking illuminates exposure. Are you over-concentrated in certain sectors? Is your capital tied up for too long in underperforming assets? Data-driven risk management allows for:
- Optimal Position Sizing: Tailor position sizes based on the observed risk and return profiles of different wheel setups.
- Diversification: Identify sectors or individual stocks that exhibit correlation in performance, prompting better diversification.
- Drawdown Analysis: Understand the typical drawdowns experienced within a wheel cycle and develop specific contingency plans.
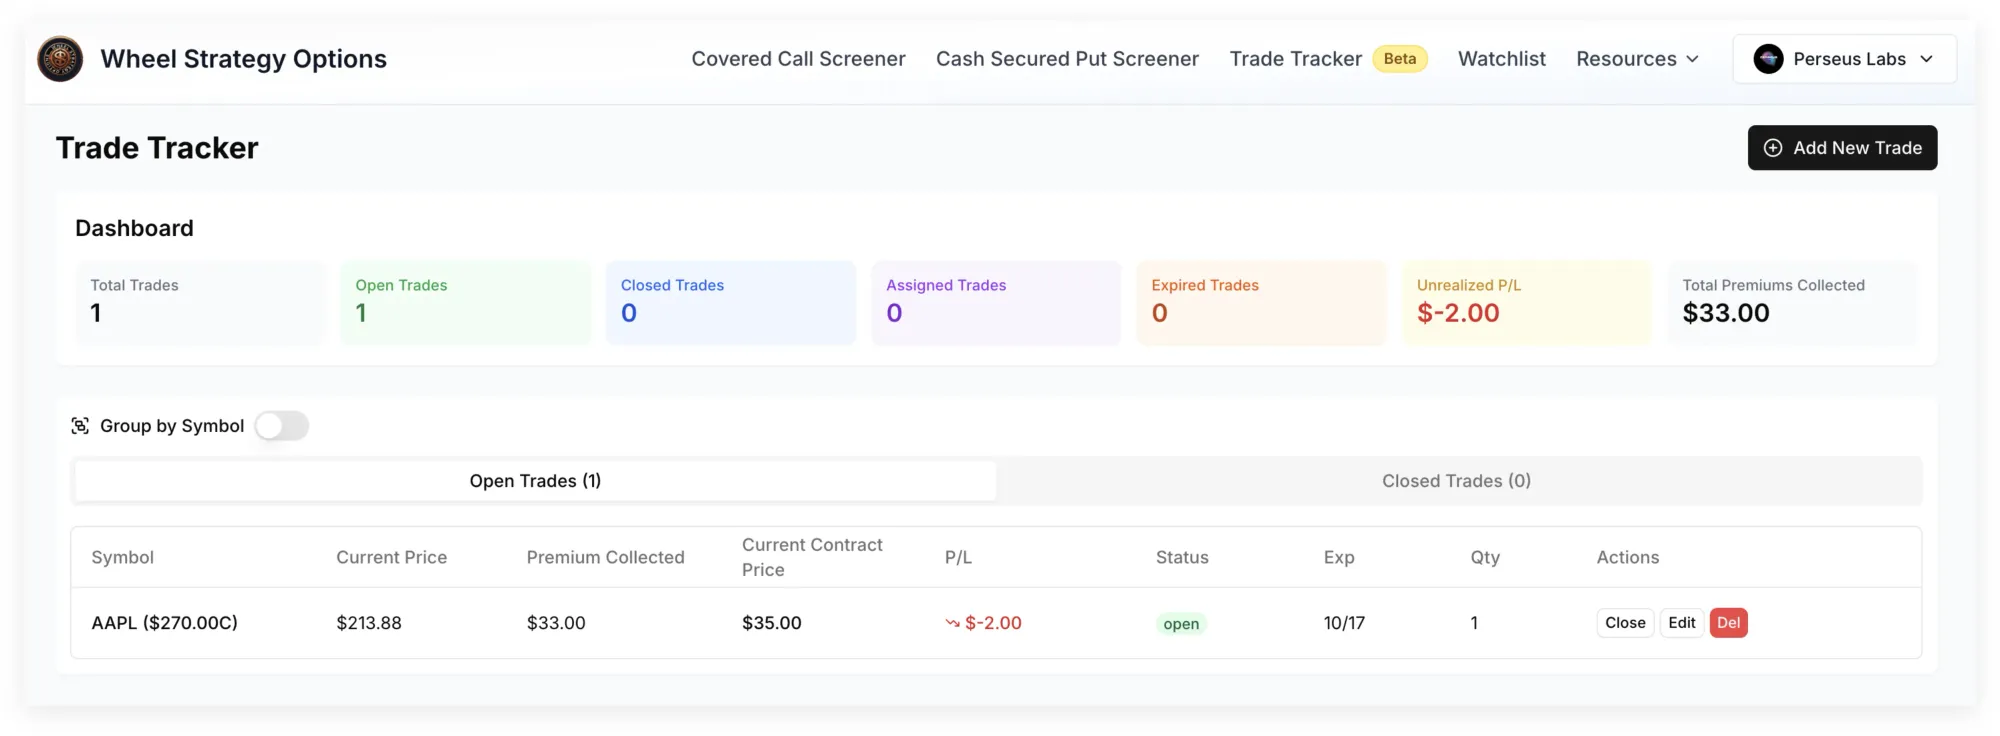
Leveraging Technology for Superior Tracking: Your Wheel Strategy Screener
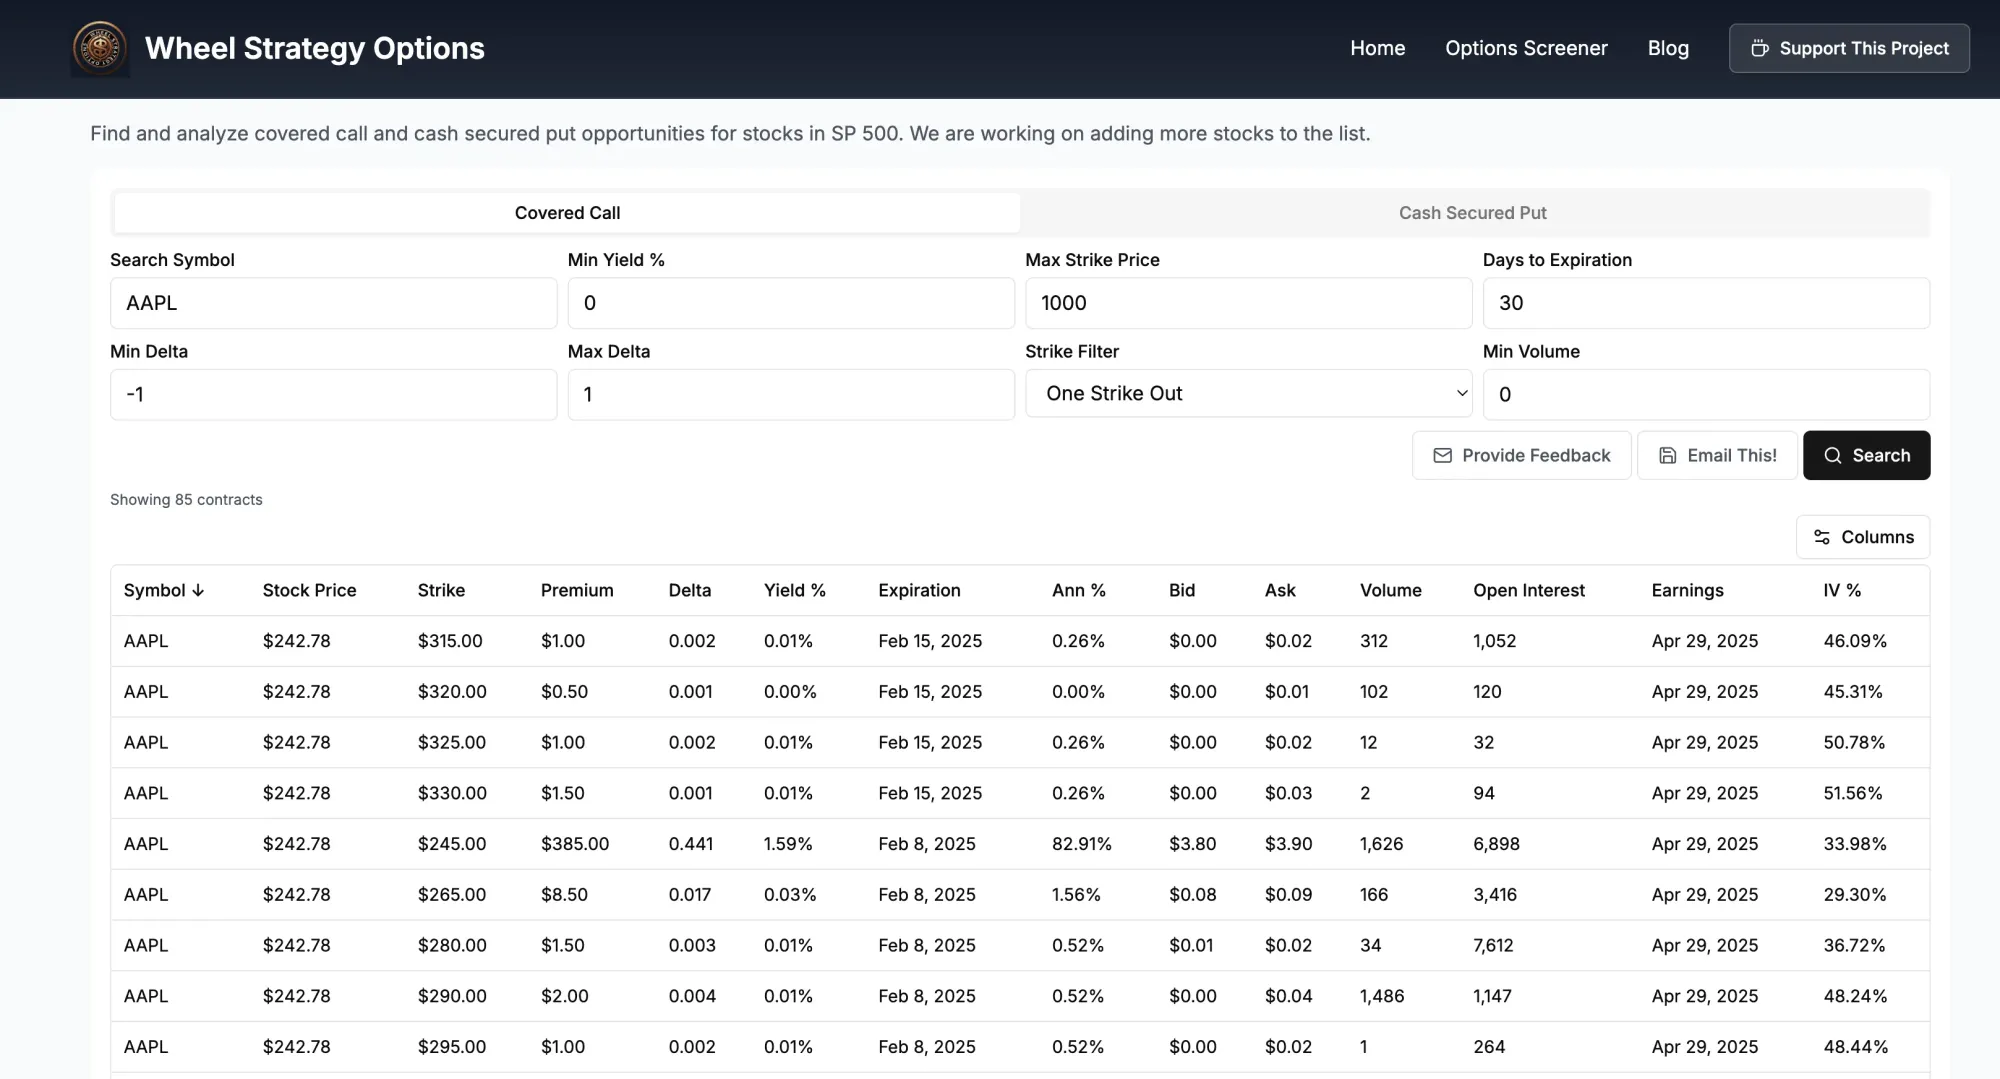
While manual spreadsheets are a starting point, dedicated tools and platforms significantly streamline the tracking and analysis process. They offer automated data capture, comprehensive reporting, and visualization capabilities that a manual system simply cannot match. For serious traders looking to elevate their wheel strategy, leveraging specialized technology is no longer a luxury but a necessity.
To identify high-probability setups and efficiently manage your positions, consider using a robust tool like our wheel strategy screener. It provides the analytical horsepower to filter, compare, and monitor opportunities, giving you a distinct advantage in the market.
The Mindset of a Meticulous Trader
Beyond the technicalities, detailed tracking cultivates a critical psychological edge. It fosters discipline, reduces emotional decision-making, and provides empirical evidence to validate or discard hypotheses. As Naval Ravikant wisely notes:
“The most important trick to be happy is to realize that happiness is a choice that you make and a skill that you develop.”- Naval Ravikant
Similarly, trading success is not merely a choice, but a skill developed through deliberate practice and continuous feedback. Meticulous tracking is the feedback loop for the wheel strategy.
Key Takeaways
- Detailed trade tracking is paramount for optimizing the wheel options strategy, moving beyond basic execution to deep performance analysis.
- Beyond simple P&L, capture granular data points for each leg of the wheel, including DTE, IV, underlying price, and specific assignment/roll details.
- Quantitative analysis of this data reveals actionable insights into optimal strike selection, DTE ranges, and the impact of market conditions.
- Leverage insights to refine risk management, position sizing, and adapt your strategy for continuous improvement.
- Utilize specialized tools like a wheel strategy screener to automate tracking and enhance analytical capabilities.
- Meticulous tracking cultivates discipline, reduces emotional biases, and is a cornerstone for long-term profitability in selling options.
Disclaimer: *This blog post is for informational purposes only and should not be considered financial advice. Trading options involves risk of loss. Conduct thorough research and consult with a qualified financial advisor before making any investment decisions.*
Follow us on:
Threads | X (Twitter) | Reddit | Instagram
Comments ()