How to Read a GEX Heatmap to Pick Option Strikes
Strike × expiry GEX heatmap for option sellers: read call/put walls and zone, then pick CC and CSP strike bands. NVDA snapshot walkthrough included.
Quick answer: A GEX heatmap is a strike × expiry grid of dealer gamma. Green cells stack call-side hedging pressure (often resistance); purple cells stack put-side pressure (often support). To pick strikes to sell, set your DTE window, read the call wall and put wall, check whether the zone is positive or negative, then confirm premium, delta, and liquidity in a screener—never sell on the heatmap alone.
Education only—not a recommendation to buy or sell NVDA, any option, or any strike. Heatmap levels move with open interest and can be wrong. Size every position to your own risk.
What a GEX heatmap shows that a single GEX chart does not
Our earlier guide on gamma exposure for wheel traders covers the gamma flip, call wall, and put wall on a strike-level view. A GEX heatmap adds the second axis premium sellers actually care about: which expiration that gamma sits in.
On the GEX Heatmap, rows are strikes and columns are expirations. Each cell is net, call, or put GEX for that strike–expiry pair. Intensity matters more than the exact printed number: brighter green means a denser positive cluster; denser purple means a denser negative cluster.
That matrix answers three seller questions in one glance:
- Where is the call wall (candidate resistance for covered calls)?
- Where is the put wall (candidate support for cash-secured puts)?
- Which near-term expiries carry the most net gamma—and which look quiet?
Positive zone / positive net GEX usually lines up with mean-reverting dealer hedging (sell rallies, buy dips). Negative zone often means moves can run farther and faster, so you want wider strikes or smaller size. Treat the zone as a risk dial, not an on/off switch.
How option sellers translate walls into strikes
Walls are starting points for a screener search—not magical magnets. The practical rule we use in product copy is simple:
| Signal | What you see | Seller starting point |
|---|---|---|
| Call wall | Heaviest call-side / positive GEX cluster at or above spot | Covered calls at or above that strike |
| Put wall | Heaviest put-side / negative GEX cluster at or below spot | Cash-secured puts at or below that strike |
| Positive zone | Net dealer GEX constructive near spot | Premium selling generally friendlier; still check walls |
| Negative zone | Net dealer GEX short near spot | Widen strikes, shorten DTE, or cut size |
| Net GEX by expiry | Sidebar totals per expiration | Prefer expiries you actually sell; note which columns dominate |
After the heatmap gives you a strike band, open the covered call screener or cash-secured put screener and filter for your DTE, delta, and yield. Heatmap first for structure; screener second for tradeable contracts.
Worked example: NVDA heatmap snapshot (process, not a trade)
The screenshot below is a same-day process walkthrough from the Maxx GEX Heatmap on NVDA. Numbers will have moved by the time you read this. Use the method, not the print.
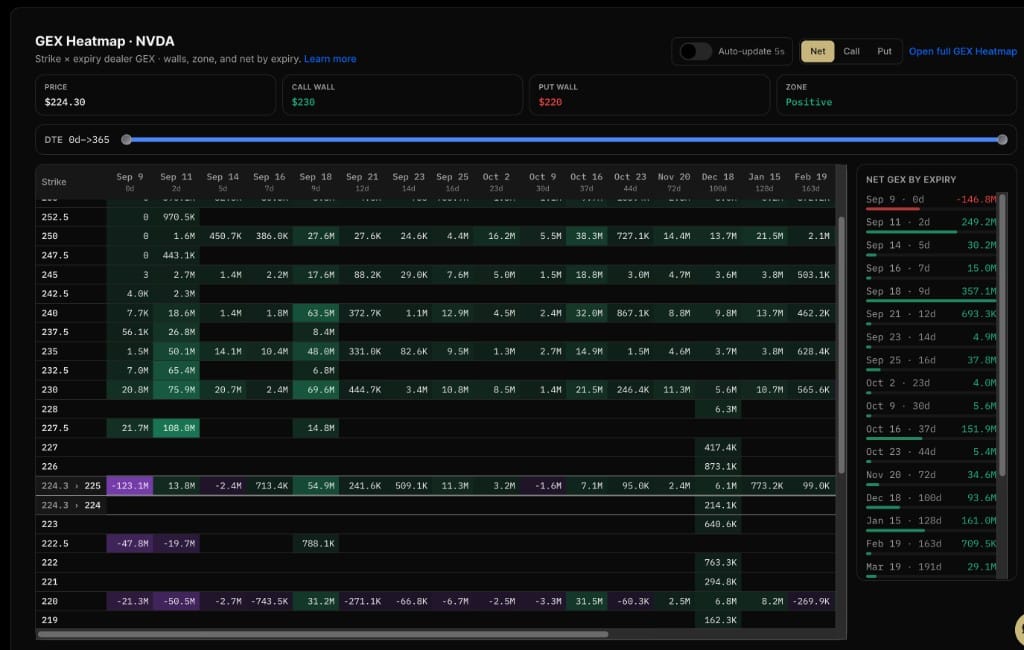
From the key-level strip on that snapshot:
- Price: $224.30
- Call wall: $230 (green)
- Put wall: $220 (red)
- Zone: Positive
That positive zone says the near-spot structure was more range-friendly than a negative-gamma tape. It does not mean NVDA cannot gap. It means dealer hedging, if the model is right, was more likely to dampen moves than amplify them while that regime held.
Covered call side of the map
The call wall at $230 lines up with dense green cells across several near expiries—especially mid-September columns where positive GEX piles up at that strike. For a seller who already owns (or is willing to own) 100 shares, the heatmap starting band is $230 or higher: keep the short call at or above the wall so the densest call-side cluster sits under your strike, not through it.
Next, glance at the Net GEX by expiry sidebar. On this snapshot, Sep 9 (0d) was net negative while Sep 11, Sep 18, and Sep 21 flipped net positive, with Sep 21 among the larger near-term positives. If you sell 7–21 DTE covered calls, you would compare those positive columns—not blindly sell the first weekly that prints a fat premium. Quiet or negative near expiries can still be fine, but you should know you are selling into a different hedging backdrop.
Only then open live chains—e.g. the NVDA covered call page—and check:
- Delta roughly in your usual band (many wheel CCs sit near 0.20–0.35)
- Open interest and bid/ask you can live with
- Premium vs how much upside you are willing to cap
Cash-secured put side of the map
The put wall at $220 shows up as purple weight at and around that strike. For CSPs, the starting band is $220 or lower: stay at or below the put wall so you are not short a put sitting above the densest support cluster. If assignment would force you to own NVDA at a basis you dislike, that is a capital decision first—the heatmap only helps you place the strike relative to structure.
On this snapshot there is also a visible “gap” of thinner GEX between spot (~$224) and the heavy $230 green stack. That empty band is useful context: price can travel through thin cells faster than through thick walls. Do not treat thin cells as safe; treat thick walls as the levels worth measuring against.
A six-step routine before you sell
- Open the heatmap for your ticker on the GEX Heatmap and set Net view (then Call or Put if you want to isolate one side).
- Set the DTE slider to the window you actually trade—weeklies (0–7), monthlies (0–30 or 0–45), or a wider 0–60 band. Walls change when far LEAPs dominate the matrix.
- Read Price, Call wall, Put wall, Zone from the key-level strip before you stare at every cell.
- Scan Net GEX by expiry so you know which columns dominate the structure you just labeled.
- Pick a strike band: CC at/above call wall; CSP at/below put wall. In a negative zone, start wider or smaller.
- Confirm in a screener with delta, DTE, yield, and liquidity—then size the trade. Log it in the trade tracker if you run a full wheel cycle.
Common mistakes when sellers use GEX heatmaps
Treating walls as guaranteed magnets. Walls are heavy open-interest / gamma clusters. They can migrate after a big roll, an earnings print, or a short squeeze. Re-check the same day you sell.
Mixing DIY educational GEX with Maxx dealer heatmaps. The free Strike GEX tool is an open-interest estimate for learning walls and flips. The Maxx heatmap is a strike × expiry dealer-positioning map. Use both if you want, but do not assume the numbers match.
Ignoring expiry. A bright green cell in a LEAP column does not mean next Friday’s short call is “protected.” Match the column to the DTE you sell.
Skipping the screener. Heatmaps do not show your fill, your delta, or your assignment cash. Structure first, then contract selection.
Selling right on a purple cliff in a negative zone. Heavy negative GEX through your short strike is often where moves accelerate. Prefer calmer cells or accept that you need more premium for the risk.
When the heatmap matters most for the wheel
Heatmaps earn their keep on liquid names with dense options chains—indexes, mega-caps, and active single names like NVDA. Thin underlyings produce sparse grids and noisier walls. Around earnings, treat walls as soft: IV is elevated, open interest reshuffles fast, and a positive zone can flip after the print.
If you are hunting richer premium first, pair the map with Top IV stocks, then bring those tickers into the heatmap before you write the short option. Structure after you know the name is worth the capital.
Keep the loop short: heatmap for structure, screener for the contract, tracker for the cycle. If a wall moves overnight, update the strike band before you add size—do not average into yesterday’s map.
Frequently asked questions
Is a GEX heatmap the same as a GEX calculator?
No. A calculator or strike chart usually collapses GEX into one dimension (strike). A heatmap keeps strike and expiration as a matrix so you can see which expiry owns the wall. Sellers need both the wall level and the expiry context.
Should I always sell covered calls above the call wall?
That is the default starting band we teach—at or above the call wall—because the densest call-side cluster then sits beneath your short strike. You can sell closer for more premium if you accept a higher assignment chance. The wall is a bias, not a rule.
What if the zone is positive but my preferred strike sits in purple cells?
Trust the local cell more than the headline zone for that strike. A positive tape with a purple cliff at your short put still implies faster downside through that level. Widen the strike, shorten DTE, or skip the name.
How often should I refresh the heatmap?
Same day you sell is the minimum. Walls and net-by-expiry totals can shift after large rolls and around monthly OPEX. If you leave a short option on for two weeks, re-check before you roll—do not reuse last month’s screenshot.
Next step: Open your ticker on the GEX Heatmap, mark call wall / put wall / zone for your DTE window, then build the contract in the covered call screener or CSP screener.
Comments ()